A physics-inspired framework for dynamic portfolio optimization with adaptive machine learning calibration.
Q-GAP models financial markets as dynamic physical systems and derives portfolio weight configurations from a proprietary, physics-inspired optimization process — augmented by an adaptive machine learning layer that recalibrates the model to prevailing market conditions.
Q-GAP departs from classical mean-variance and risk-parity paradigms. Its architecture is built on three conceptual pillars; the exact mathematics behind each remains proprietary.
1
Dynamic Interaction Structure
The asset universe is represented as a dynamically evolving interaction structure, inspired by concepts from theoretical physics and complex systems, incorporating time-varying relationships between assets determined through proprietary interaction and stability measures.
2
Physics-Inspired Optimization Engine
Portfolio weights are treated as the configuration of a physical system evolving under a proprietary dynamical process, deriving continuous optimal weight configurations rather than solving independent static problems at each rebalancing date.
3
Adaptive Machine Learning Layer
An adaptive machine learning component characterizes prevailing market conditions, supports the adaptive calibration of the optimization process, and recalibrates the model's internal parameters accordingly.
Scope of Disclosure
This publication intentionally separates scientific validation from proprietary implementation: its objective is to disclose the conceptual framework and empirical evidence while preserving the mathematical formulation, optimization engine, parameterization, calibration procedures, and implementation as protected trade secrets. No source code, exact mathematical specification, or other detail sufficient to reconstruct the Q-GAP engine is disclosed publicly. Read the full public summary on Zenodo (DOI: 10.5281/zenodo.21321206) ↗
Empirical Validation
Results, reported in full — the mechanism, withheld
Seven-asset UCITS ETF universe, January 2015 – June 2026, monthly rebalancing. All figures below are real backtest and robustness-test outputs, not projections.
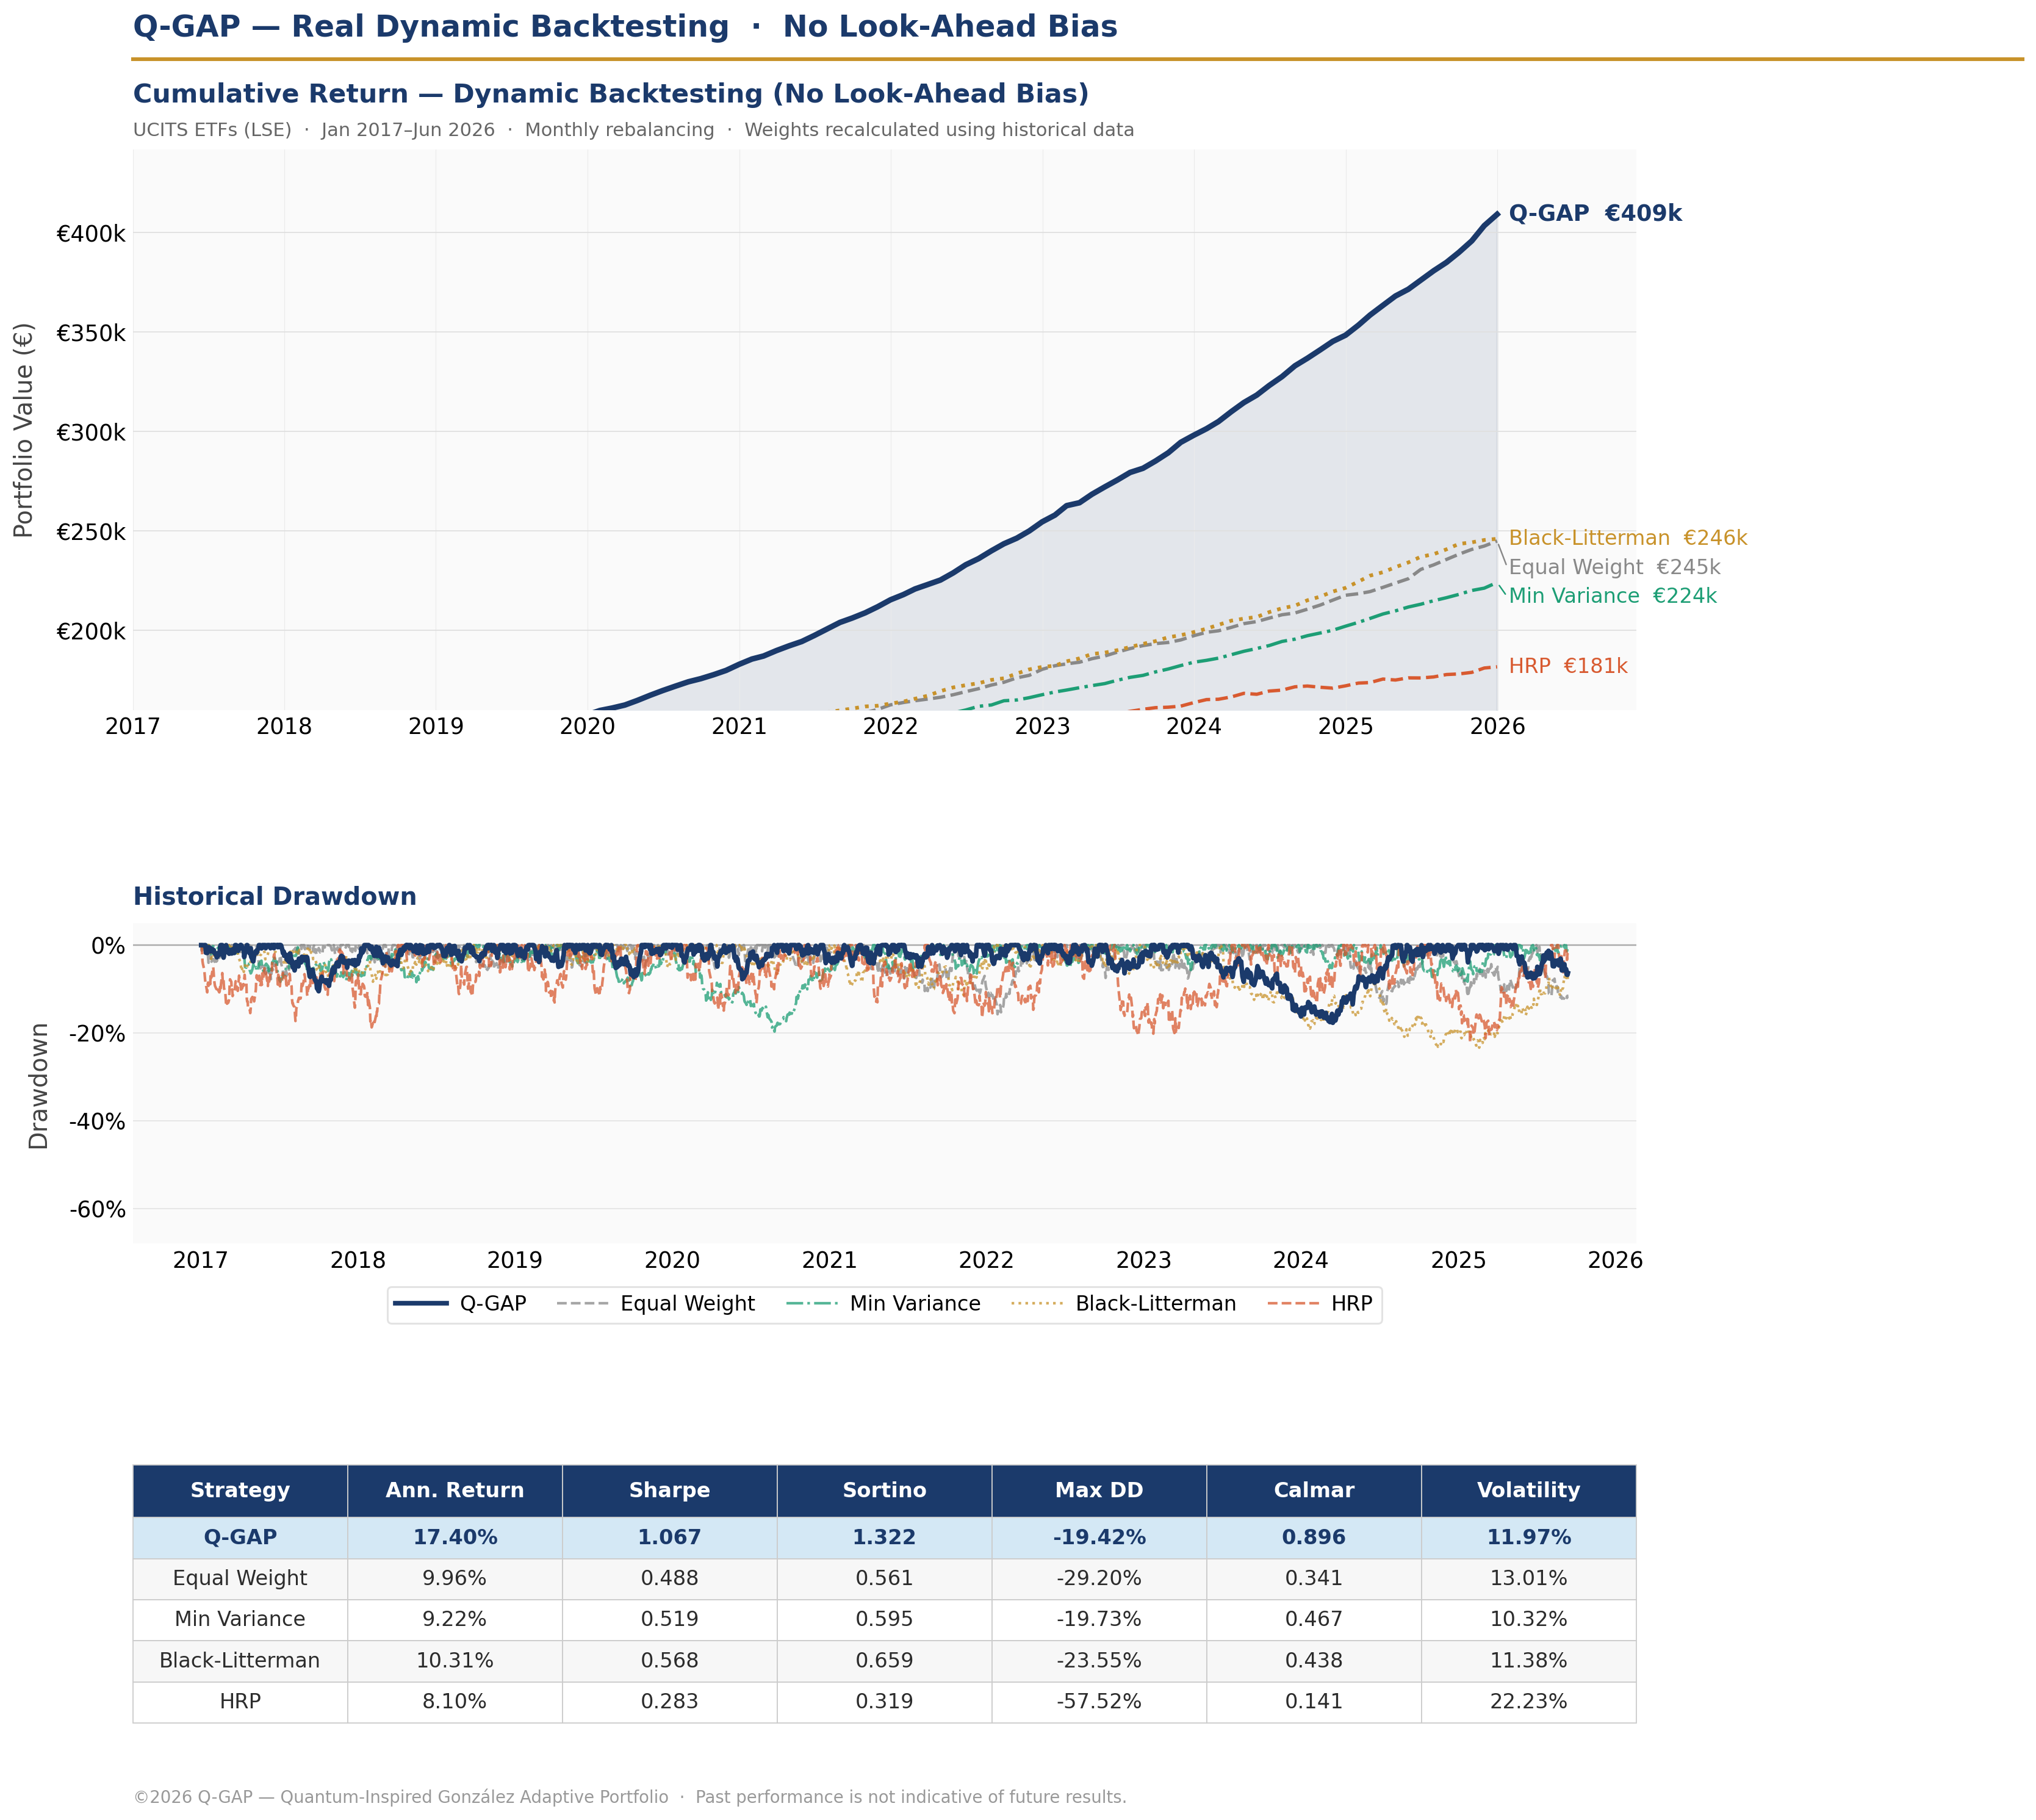
−19.42%Maximum drawdown — smallest of all 5 strategies evaluated
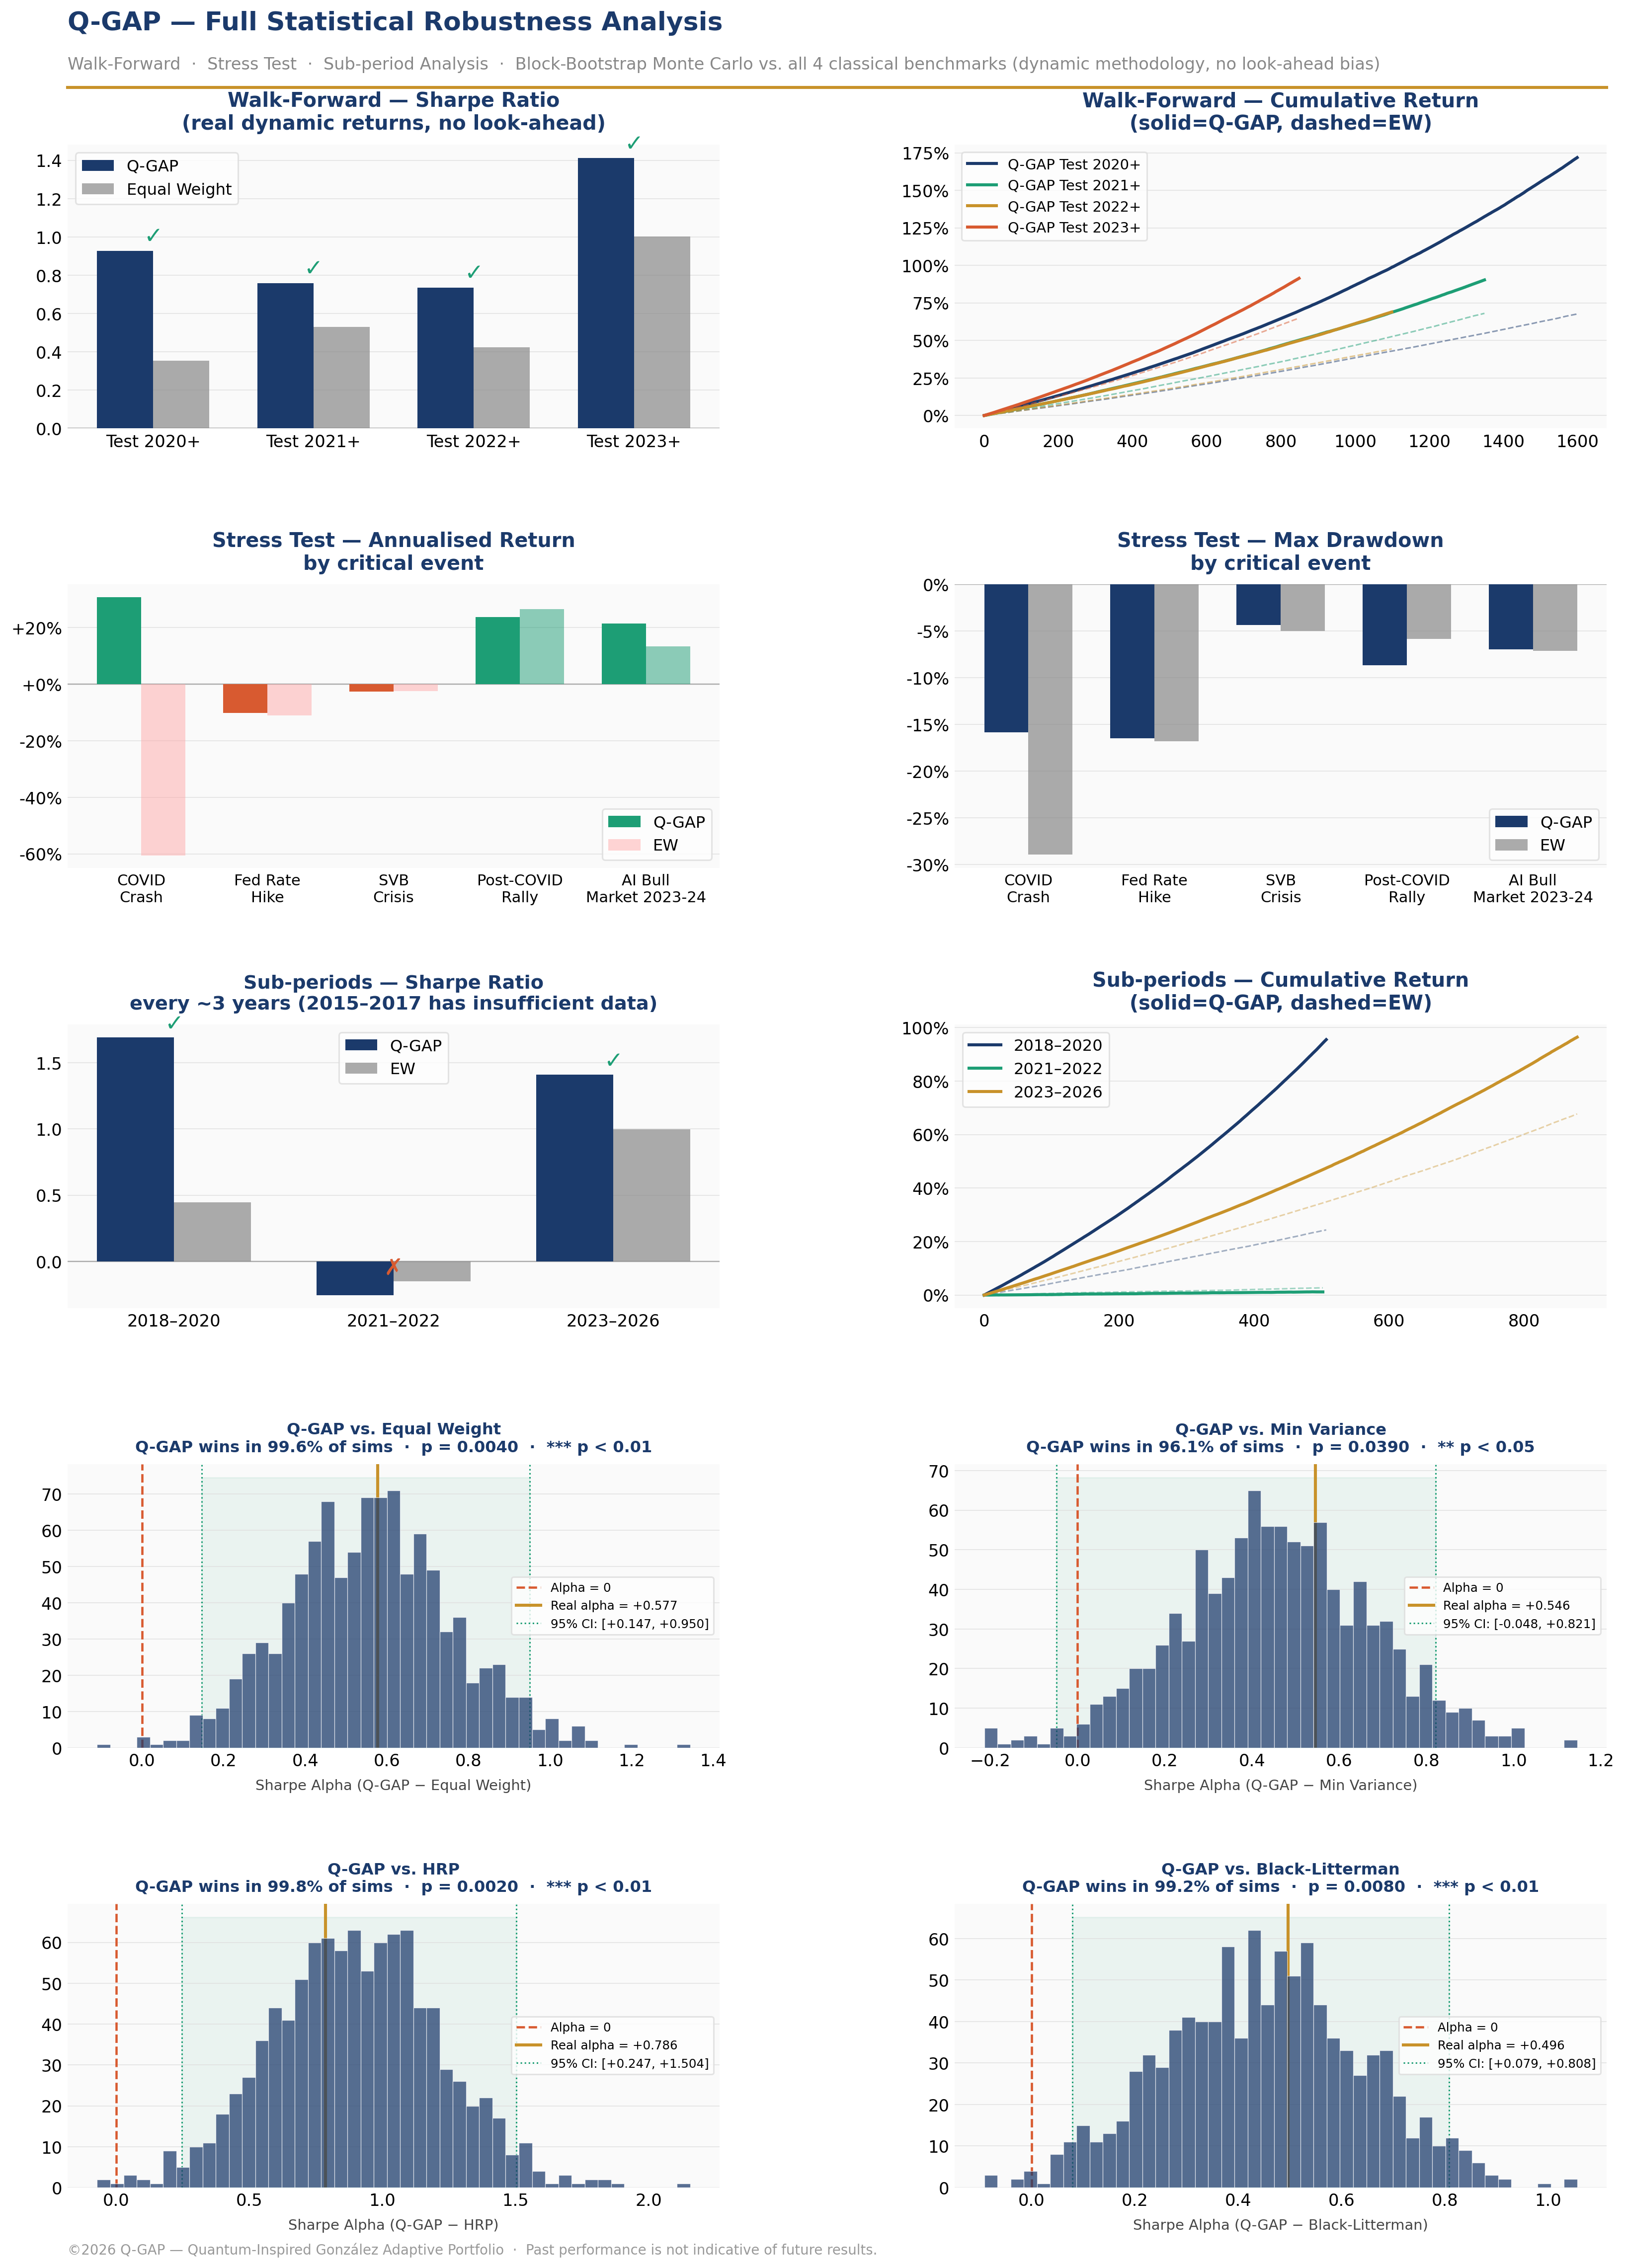
0.002–0.039Bootstrap p-values vs. all 4 classical benchmarks
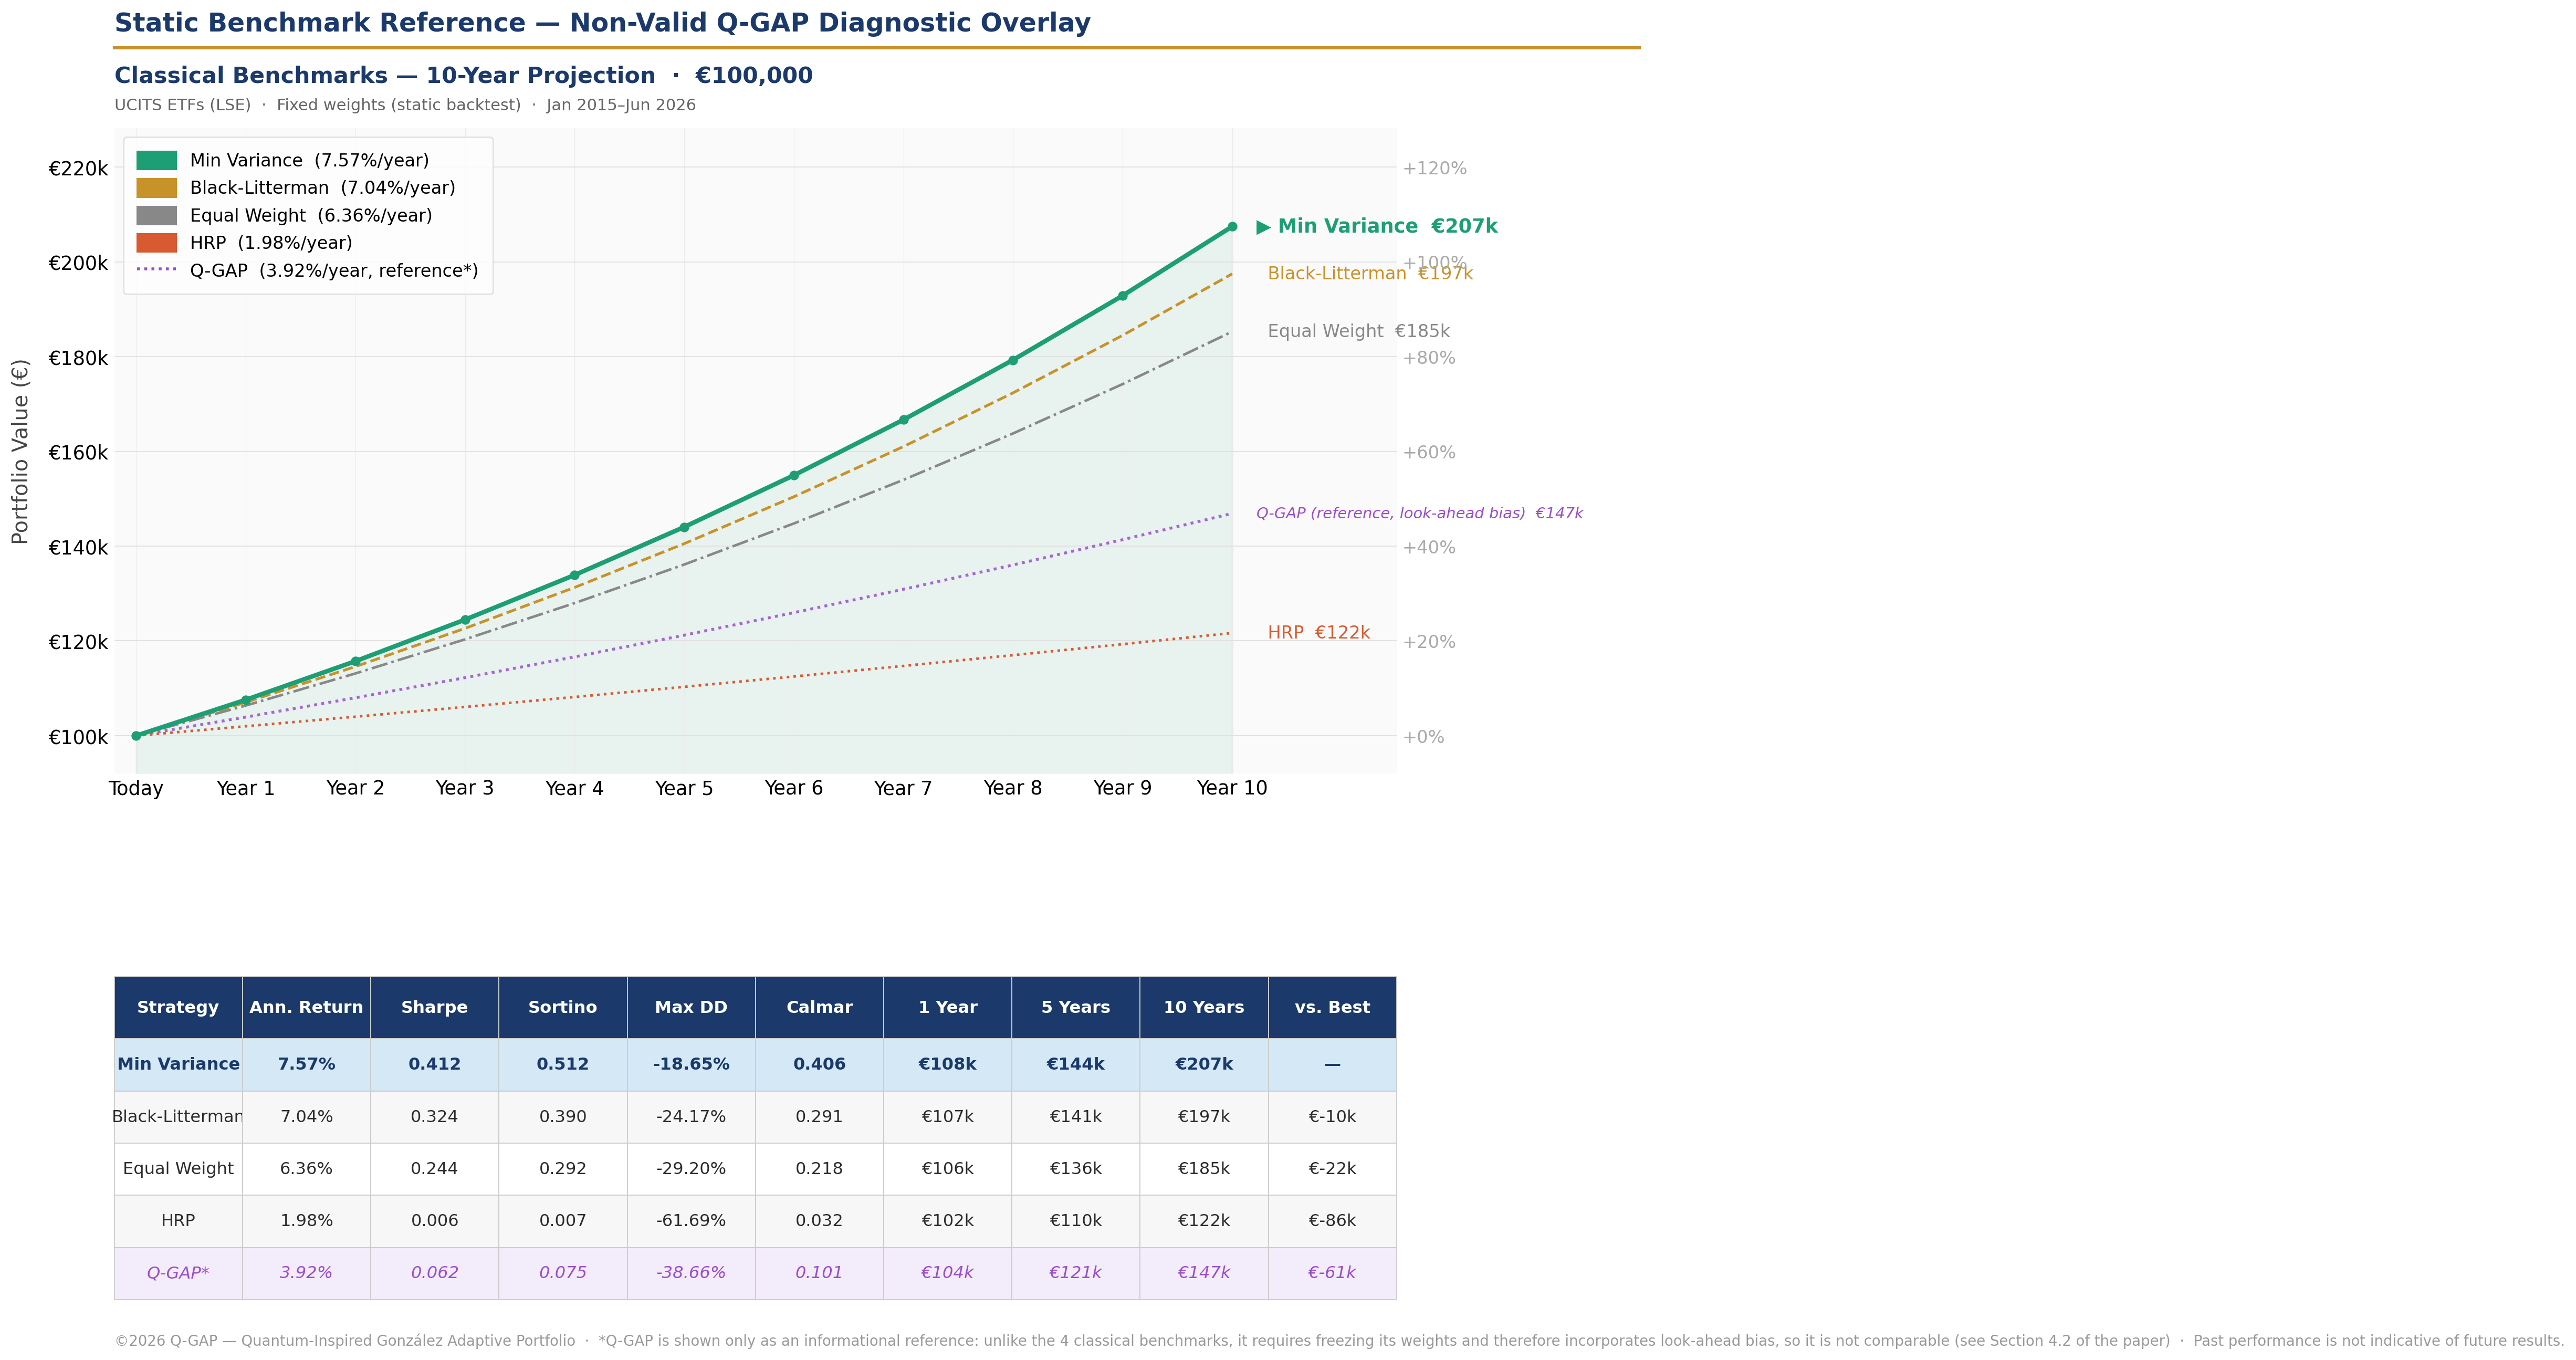
Q-GAP vs. classical benchmarks — Equal Weight, Minimum Variance, HRP, and Black-Litterman, evaluated on the same real dynamic return series with no look-ahead bias.Dynamic backtesting, look-ahead-free weight computation — the methodologically valid evaluation of Q-GAP, in which it achieves the highest annualized return and dominates all four classical benchmarks in Sharpe, Sortino, and Calmar.Robustness suite — walk-forward windows, event-based stress testing, sub-period analysis, and 1,000-simulation block-bootstrap Monte Carlo against all four classical benchmarks.
Methodology
Four-level validation protocol
This transparent protocol — reporting all four validation levels with their respective limitations — distinguishes rigorous quantitative research from selective result reporting.
Level
Methodology
Q-GAP Sharpe
vs. Best Benchmark
Status
1. Static
Classical benchmarks only — reference ceiling under perfect information
N/A
N/A
Reference
2. Dynamic
Look-ahead-free weights, pre-trained ML layer
1.067
+87.9%
Validated
3. Robustness
Walk-forward, stress test, sub-periods, bootstrap
—
96.1–99.8% of scenarios
Validated
4. Fully walk-forward
ML layer recalibrated monthly, no full-sample fit
1.037
+82.6%
Validated
Commercial Availability
Institutional licensing, under NDA
The complete Q-GAP framework — including its mathematical formulation, optimization engine, implementation, calibration procedures, and software — remains proprietary. It is currently available for:
Institutional Licensing
Asset Managers
Banks
Hedge Funds
Family Offices
Strategic Investors
Joint Research Collaborations
Access to the full methodology is provided only under a non-disclosure agreement. Patent protection has deliberately not been pursued for Q-GAP's mathematical core, as public disclosure through the patent process would require revealing elements of the proprietary methodology — Q-GAP is instead maintained and protected as a trade secret.
This publication discloses only the scientific concept and empirical validation of Q-GAP. The mathematical formulation, optimization process, optimization engine, implementation, source code, parameterization, training procedures, and all information required to reproduce the system remain protected as trade secrets under Directive (EU) 2016/943. No license, express or implied, is granted to reproduce or commercialize the underlying methodology.
Get in Touch
Request access to the full methodology
For licensing inquiries, due diligence packs, or joint research collaboration, contact directly.
Q-GAP is a working, empirically validated framework — not a whitepaper concept. Institutions
evaluating the technology can request the full Scientific Technical Summary (public) as a
starting point, followed by a technical due-diligence briefing under NDA.